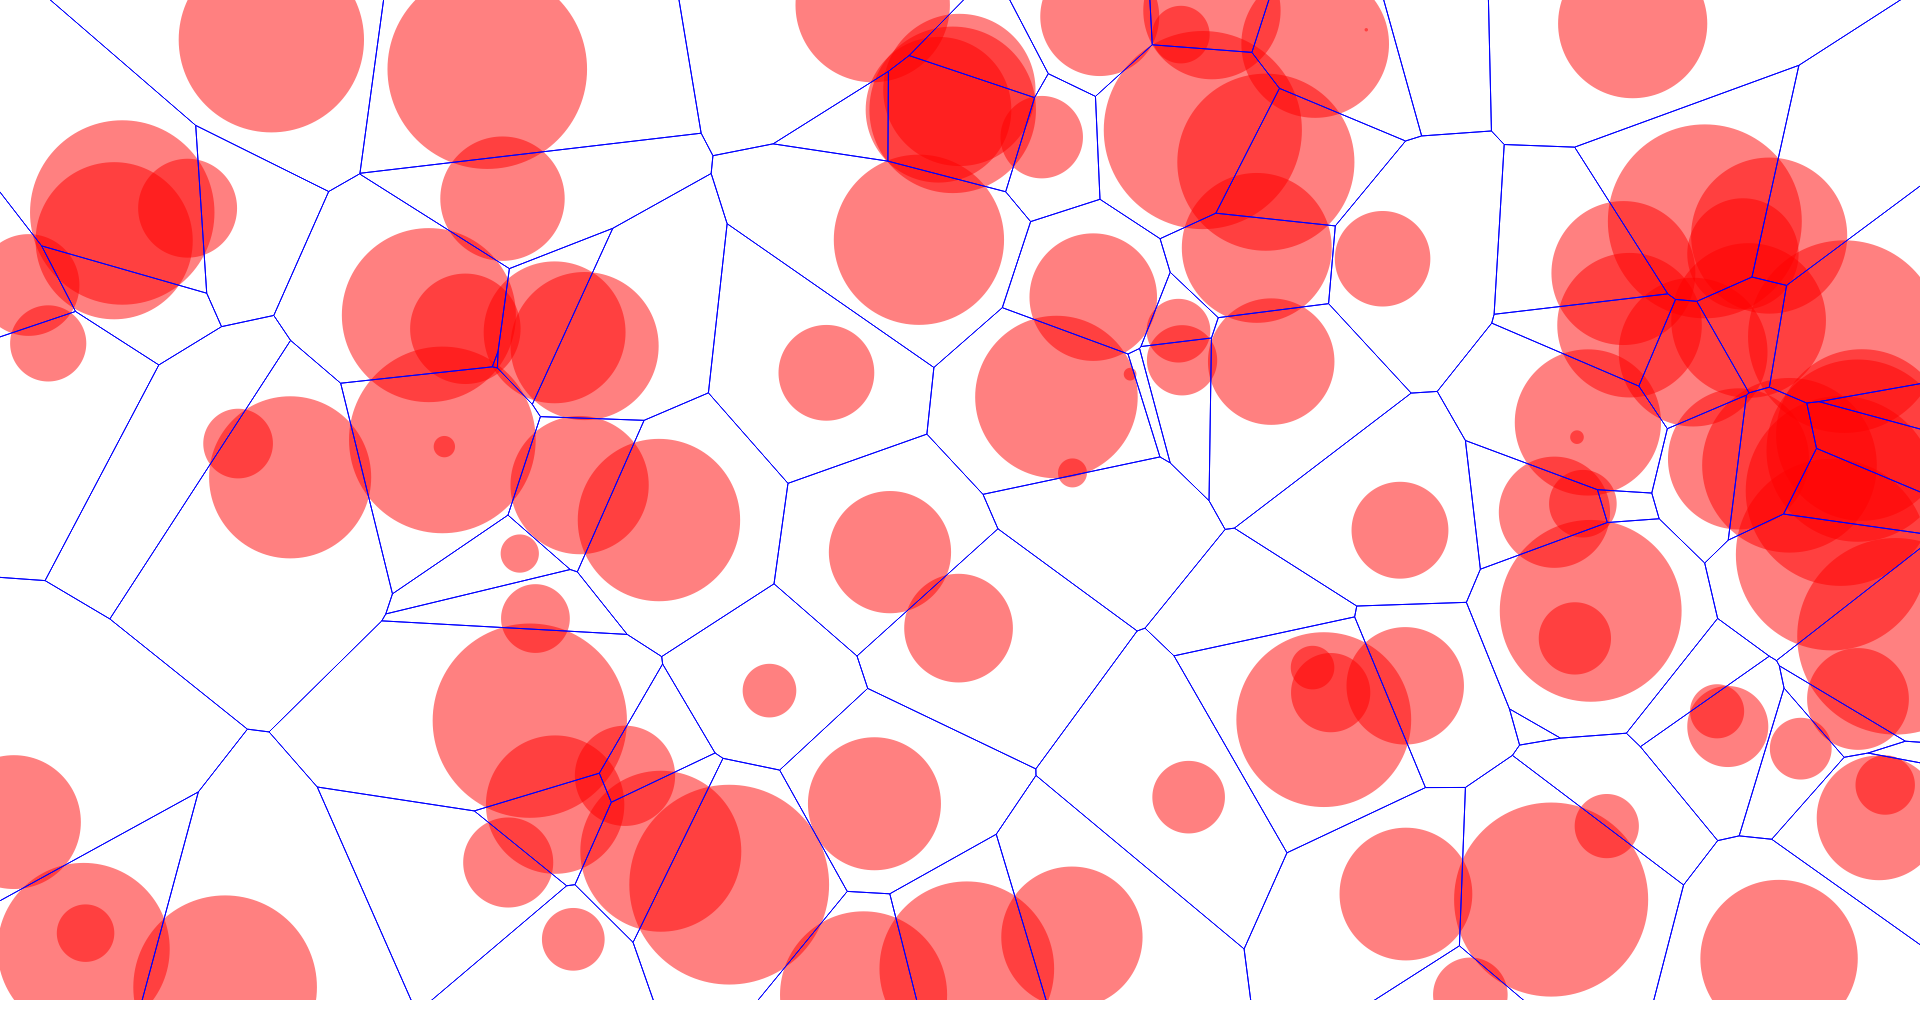
A power diagram is a type of weighted Voronoi diagram. Instead of each region consisting of the closest points to a site, it consists of the points with the smallest power distance for a particular circle.
This produces Voronoi regions with straight edges, unlike the additively- or multiplicatively-weighted Voronoi diagrams, which yield nonlinear curves.
The power diagram can be used to quickly compute a Voronoi treemap.
Copyright © Jason Davies.